Stop cutting corners | Professional article on better risk quantification through adapted modeling and target values

To quantify risks, three values are usually estimated, which are used to create a representation with a three-point distribution: the minimum value (best case), the maximum value (worst case) and the most likely value (most likely case). Such distributions can be created intuitively and quickly, even without prior statistical knowledge.
The standard courses that result from this can be represented by a variety of different distributions, for example, as a triangle or as a curve (PERT distribution, short for “project evaluation and review technique”). Both representations start at the minimum value, end at the maximum value, and show the highest point at the most likely value. The risks quantitatively represented in this way are clearly limited, and their shapes are all similar: while a triangle has straight lines and a peak, a PERT distribution is a curve with a high point and a gentler drop towards the maximum value (Fig. 1).
However, the weaknesses of three-point distributions also lie in their standardized representation and the limitation of risks: Values and limits must be set correctly to realistically depict the resulting course—this cannot be achieved with extreme values and fixed limits. Not every risk is limited in its effect. And many years of experience are usually not enough to accurately assess a best and worst-case scenario (opportunity and risk) as well as the most likely scenario for a company. Risks do not fit into a scheme—and therefore standard processes with extreme values and hard limits cannot do them justice.
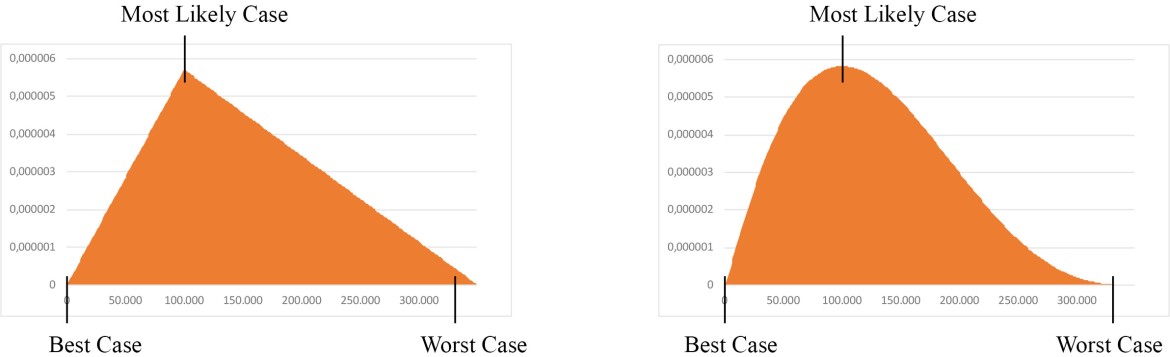
Figure 1: Course of a triangular and a PERT distribution (short for “project evaluation and review technique”).
“Soft” limits and quantiles
It is important to simplify the risk assessment in order to determine realistic and well-founded values (parameters) that can be justified and validated. This requires first accepting that risks can be unlimited and that absolute upper and lower limits offer insufficient leeway.
If the “hard” limits are set too high or too low, parts of the risk that are outside these limits will be overlooked. If the maximum impact of a risk cannot be estimated, an intuitively set limit would blind the company to risk effects above that limit. In the event of an occurrence, the company would then not be prepared for the effects of such a level. In practice, this can lead to an overestimation of a company’s risk-bearing capacity.
Quantiles in combination with a percentage degree of certainty (“10% certain”, “70% certain”, etc.) can be used to determine “soft” limits: from a “realistic best case” to a “realistic worst case”. In this way, it is estimated step by step to a specific percentage of certainty that the expected effects of a risk under consideration are below or above the value set. This results in more flexible input data for the specific risk, the course of which can be represented more precisely and mapped with a polynomial distribution.
Polynomial distribution
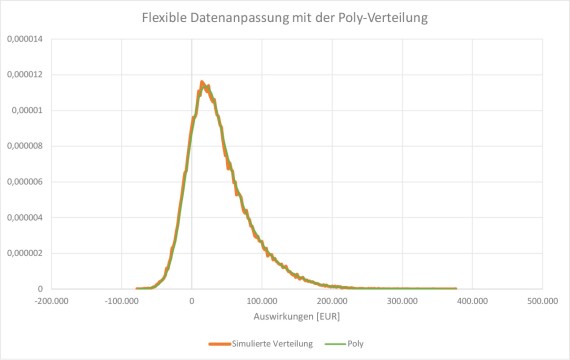
A polynomial distribution (poly-distribution for short) enables flexible adaptation to the individual course of a risk. Unlike three-point distributions, a poly-distribution (shown in green in the diagram, following the course of the simulated orange distribution) is not bound by limits or a fixed shape—it has a variable shape that is automatically extrapolated and can be limited on both sides or unlimited as well as limited on one side only. It is characterized by shallowly sloping foothills—this is particularly long in the direction of the maximum. This means that even unlikely scenarios with very high losses (very bad cases) are considered. Three or more parameters are required for a poly-distribution.
Alternatively, there is the so-called expert distribution: a special modification of the poly-distribution that is based on exactly three quantiles (a realistic upper and lower value as well as the median) and optional limit values. This combines the ease of use of the three-point distribution with the flexibility of the poly-distribution.
Disaggregation and Monte Carlo simulation
For a more realistic assessment of a risk, it is advisable to break it down into its individual components—i.e., the many factors that make it up (known as disaggregation). It is easier to assess these separately and then add them back together to form an overall value using a Monte Carlo simulation. This methodical evaluation allows the parameters to be set more precisely and accurately.
A Monte Carlo simulation can be used to further substantiate expert assessments using a mathematical process: The correlating uncertainties that drive a risk are simulated several thousand times to be able to produce a forecast of the results that is as accurate as possible. A Monte Carlo simulation therefore generates a realistic frequency distribution of the effects of a risk.
Comparison of methods
A direct comparison (Fig. 3) shows at first glance that the poly-distribution is the only one that can realistically reproduce the simulated input data. Due to its flexibility, it lies precisely over the course of the gains/losses and adopts their shape.
The triangular and PERT distributions, on the other hand, show strong deviations from the input data due to their standardized curves. Although the minimum and maximum values match, the probability of occurrence of the most probable value is significantly underestimated, while large opportunities and losses are dramatized and overestimated.
Even an assessment by experts—at least without an underlying preliminary calculation—hardly matches the simulated input data: The most likely value is estimated too high in the example, the chances are slightly too low and extremely negative effects are classified as disproportionately likely—however, the maximum value was still set too low, meaning that very high, albeit very unlikely, risks are excluded.
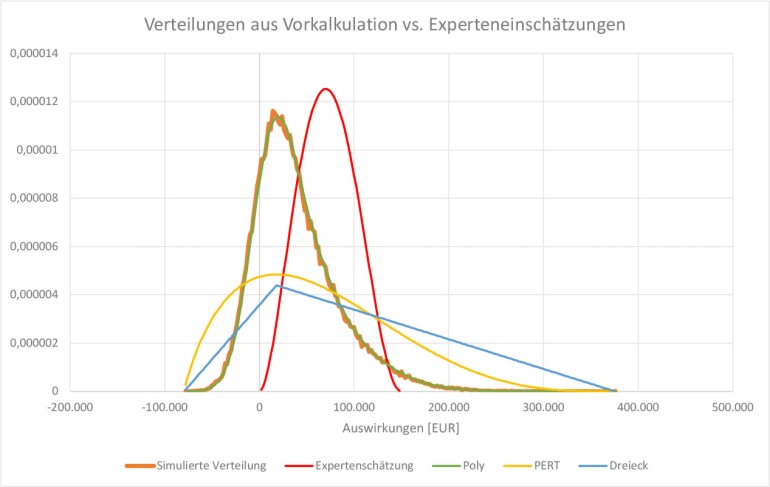
Figure 3: Comparison of a triangular (blue), PERT (yellow), and poly-distribution (green) as well as an expert estimate (red) with realistic input data (orange).
Experiment: extreme value estimation versus quantiles and soft limits
In the author’s risk management seminars, fifty experts were asked for an experiment to give their assessment of the risk of a fictitious project consisting of ten subtasks (uncertainties). The task stated that each project day would cost €5,000 and that the project would only be completed when the last task had been completed. The risk to be assessed was the deviation from the plan. The experiment aimed to show that even the evaluation of such an ideally simple project is difficult to accomplish—especially when extreme values are used. For this reason, both the assessment of extreme values and the assessment of quantiles and soft limits were compared with a Monte Carlo simulation.
The expert assessments using extreme values differed considerably, with deviations of up to 500%. The most likely case was predominantly placed roughly in the middle between the best and worst case, which shows how difficult it is to assess the “most likely” case. Figure 4 illustrates that the majority of experts (mainstream)—compared to the groups of outliers at the top and bottom—are in the middle of the simulated course (orange). Nevertheless, none of the values match the simulated distribution: The minimum value and most likely value were estimated too high, while the maximum value was set much too low. The distribution of the lower outliers (grey) reflects a view that is too positive and underestimates the risk. The course of the upper outliers (yellow) shows an over-dramatization of possible losses—both for the maximum value and the most probable value.
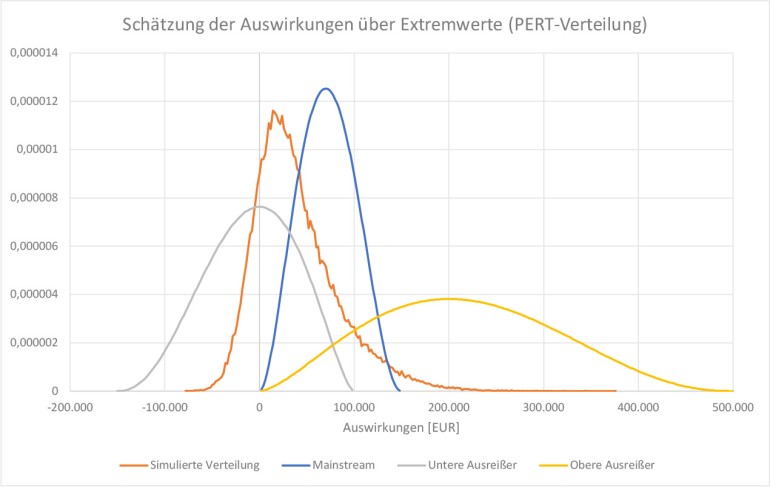
Figure 4: Comparison of expert estimates using extreme values with distribution deviations of up to 500%.
Such a large variation shows that extreme cases are obviously too abstract and difficult to imagine. As a result, the values are imprecise and too subjective. Any error or inaccuracy in a risk assessment distorts the final result, making it unreliable. When estimating quantiles, on the other hand, the experts were asked for values that would “almost certainly” not be exceeded (with a probability of 90%). These estimation results were much closer to each other and to the simulated distribution—the deviations were less than 10%.
It was noticeable that the participants thought longer and more thoroughly about the individual values and also discussed them. The disaggregation into individual factors significantly increased access to the risk. The assessment of the realistic best case was perceived as particularly difficult.
Figure 5 shows that all distributions have the same soft boundaries and only differ slightly in their shape: The simulated distribution (orange) is steeper on the left-hand side and has a flatter slope on the right-hand side than the curves of the expert estimates—the most probable values of the distributions are also slightly offset. The high level of agreement and low dispersion of the various expert assessments suggest a higher level of transparency. The fact that the individual parameters could be discussed and justified means that the values are more objective, accurate and reliable. The methodological approach with parameters in more flexible dimensions seems to make the risk assessment in the experiment clearly more descriptive and more precise and to ensure more reliable results.
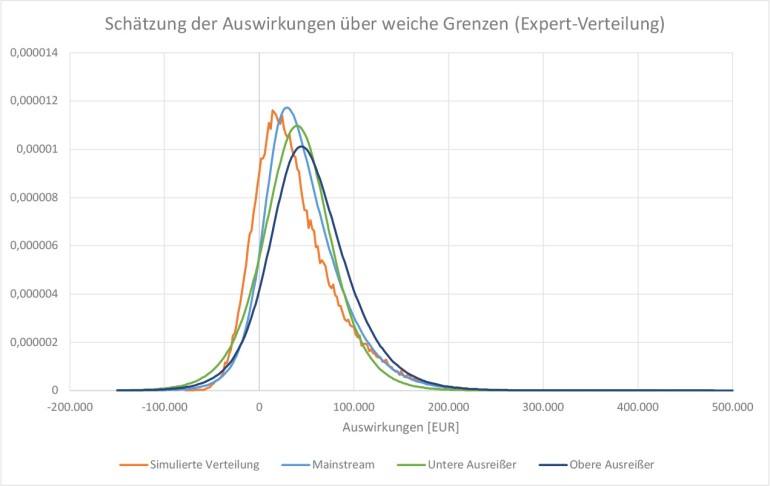
Figure 5: Comparison of expert estimates of quantiles and soft limits with deviations of less than 10%.
OMNITRACKER Risk Management supports you in all important risk management tasks such as recording and prioritizing risks, automatic reminders, and escalations as well as the creation of reports and evidence. You can test the demo room for 30 days free of charge and without local installation.
Simple is often bad
When it comes to quantifying risk, the question always arises whether a preliminary calculation needs to be made, whether experts should be consulted or whether a Monte Carlo simulation justifies the effort involved in programming the model and evaluating the results. The use of expert estimates—i.e., risk experts who identify and assess possible risks—involves the least effort.
However, as the experiment described above shows, the results of expert estimates can vary greatly depending on the data used, the values required, and the complexity of the risk under consideration. Motivation also plays a major role in the quality of risk quantification: If the focus is on quick processing or the aim of conveying certainty, the result can be inaccurate and embellished. Inaccurate values are equally likely to occur if there is excessive demand: Assessing complex risks and their worst possible effects can be difficult to grasp and imagine, despite many years of professional experience. Disaggregating complex risks and assessing the individual uncertainties and subsequent aggregation are therefore essential for realistic assessments. However, if the process is oversimplified and standardized, this also leads to a distortion of the results. While experts may not otherwise be able to capture the full extent, standardization can have a similar effect to the use of extreme values: too little differentiability and unspecific statements.
For expert estimates to be sound and reliable, the right degree of simplification is required—supported by helpful tools such as a Monte Carlo simulation—and a focus on high-quality risk quantification.
Moreover, it can be a great advantage to have risk experts work together with risk managers: This allows the expert to present the facts precisely thanks to their professional experience and the risk manager to assess them. This way, the facts are assessed instead of the “pure” risk, which leads to a more well-founded and validatable risk quantification. Regular feedback on the individual risk assessments is also recommended so that misjudgments and inaccuracies can be identified retrospectively and better avoided in the future.
Good risk quantification supports governance, compliance, and ICS
Whether due to IDW PS 340 (new version), certification, or for a tender: risk assessments are often carried out when bureaucratic requirements must or should be met. Unfortunately, the focus is usually on saving time and money: The risk assessment should be verifiable as quickly as possible and no longer play a major role—the aim is to formally meet the requirements as cheaply as possible and thus avoid penalties. However, the potential offered by risk quantification integrated into corporate management remains untapped. The areas of governance and compliance, as well as the internal control system (ICS) can also benefit significantly from a well-founded risk assessment.
Governance
- Better decision-making: More precise assessment and prioritization of risks plus easier identification of opportunities form a more reliable data basis for pending decisions (PDCA cycle) and enable more efficient corporate management and strategy development.
- Better communication: Greater transparency in the area of risk-bearing capacity enables company management to communicate more openly and confidently with customers, business partners, investors, shareholders, etc.
- Easier identification and management of top risks: Careful risk assessment makes it easier to shed light on the risks with the greatest impact and find more targeted countermeasures.
Compliance
- Easier compliance with requirements and laws: Risk quantification can be used to assess risks in relation to compliance regulations, making it easier to ensure and document compliance.
- Better auditability: A sound risk quantification provides validatable, reliable values that are documented in a tamper-proof manner—ideal for reports and evidence. It also allows clear responsibilities to be defined and tracked.
- Anticipatory action planning: The early detection of risks and dangerous developments also enables countermeasures to be taken at an early stage, allowing risks to be minimized more quickly.
Internal control system (ICS)
- More efficient resource management: With a strategic prioritization of risks and measures, the ICS can be supported strategically by allocating resources to improve the ICS.
- Seamless monitoring: The results of a risk assessment can be used to ensure comprehensive monitoring of the ICS.
Conclusion
A risk quantification may often be initiated and carried out based on a specific requirement—however, the potential that such an assessment holds beyond this should not go unused. If realistic and reliable parameters (quantiles) are used as soft limits in combination with a Monte Carlo simulation and a calibratable distribution (expert or poly-distribution), a risk quantification not only provides a reliable overview of a company’s risk-bearing capacity, but also offers further significant advantages:
- Early detection of developments and risks that threaten the company’s existence
- Stronger resilience through better compliance
- More transparency regarding the risk landscape
- More efficient measures through targeted prioritization and documentation of risks
- Better resource planning thanks to well-founded and validatable values
- Cost reduction through prompt avoidance of risks and recognition of opportunities
About the authors
 Dipl. Ing. Andreas Chlebnicek worked for a long time as a software developer in the automotive and PKI environment before switching to consulting—he has been Head of Governance, Risk and Compliance (GRC) Management at OMNINET since 2021.
 Dr. Uwe Wehrspohn advises companies on the application of modern methods for measuring and managing risks and returns—he is managing director of Wehrspohn GmbH & Co. KG and research fellow at the Risk Management Research Center at the University of Würzburg.
This article was previously published in the trade magazine <kes>—the magazine for information security, issue 2023 #6, p. 60ff.